

Updated March 30, 2026
TL;DR: Open rates are directional at best and misleading at worst due to Apple Mail Privacy Protection and bot filters. True sequence performance depends on three layers: Deliverability Health (bounce rate under 2%, domain reputation monitoring), Engagement (reply rate above 5%, interested rate tracking positive responses), and Revenue (meetings booked, cost-per-meeting under $150). Track these weekly using a standardized scorecard. If bounces spike above 5%, reply rates drop below 5%, or domain health scores fall under 80, pause immediately and diagnose the root cause before resuming.
Sixty percent open rates mean nothing when your pipeline stays flat and your CFO asks what each meeting costs. Most sales leaders track activity metrics like sends and opens but cannot connect those numbers to revenue outcomes or defend their outbound budget. That gap between email activity and pipeline truth is where you lose credibility and budget.
Tracking the wrong email metrics creates a false sense of progress while your domain reputation deteriorates and your meetings-booked number flatlines. To build predictable revenue from cold outreach, you need to measure three distinct performance layers: technical health (can you land in inboxes), prospect engagement (do they care enough to reply), and revenue outcomes (do replies turn into meetings and SQLs). Everything else is noise.

Why open rates are no longer the north star metric
Apple's Mail Privacy Protection, introduced in September 2021, preloads email images when messages are delivered, inflating open rates even when users never open the email. Apple now accounts for 49.29% of all email opens as of January 2025. After six months of MPP rollout, total open rates nearly doubled from 22.6% to 40.5%, and unique open rates jumped 14 points.
Enterprise security tools like Mimecast, Proofpoint, and Barracuda scan every incoming message for malicious links, automatically downloading images and triggering links without human interaction. These scanners inflate both open and click metrics.
High open rates paired with low reply rates signal a targeting problem or weak offer, not engagement success. If 50% of your list "opens" but only 1% replies, you are either reaching the wrong people or sending irrelevant messages. Use open rates as a directional signal for subject line tests, not as proof of campaign health. Focus your weekly reviews on reply rate and deliverability metrics instead.
Deliverability metrics: The foundation of sequence performance
Deliverability is not a single percentage. It is a system that includes warmup health, inbox placement, bounce management, and domain reputation monitoring. If your emails land in spam folders or bounce back, no other metric matters.
Bounce rate: Bounce rate measures undelivered emails divided by total emails sent: (Bounced Emails / Total Sent) × 100. Distinguish between hard and soft bounces because your response differs. Hard bounces are permanent failures caused by invalid addresses or blacklisted domains, remove these immediately. Soft bounces are temporary issues like full inboxes, monitor over three send attempts before marking invalid. Keep your bounce rate below 2%. ISPs use this threshold to separate legitimate senders from spammers.
Deliverability rate: Deliverability measures your ability to reach recipient servers, calculated as: ((Total Sent - Total Bounces) / Total Sent) × 100, where total bounces includes both hard and soft bounces. A 98% deliverability rate means 2% bounced. This metric confirms whether your list quality and domain health meet basic standards, but delivered emails can still land in spam folders rather than primary inboxes.
Domain health score:Domain reputation depends on sending consistency, engagement metrics, and authentication. Mailbox providers watch how recipients treat your emails—opens, clicks, moves to primary, or spam flags—and adjust your sender score accordingly. Deliverability scores range from 0 to 100 based on spam complaints, bounce rates, and engagement over the last 30 days. We track domain health through our warmup system and provide real-time monitoring in the email accounts dashboard. You can see warmup status and health indicators for each connected inbox.
"Deliverability has been solid and reply rates improved pretty quickly with homeowners." - Jonaldie M. on G2
Watch our Ultimate Guide to Cold Email Deliverability for a complete walkthrough of maintaining strong sender reputation across multiple domains.
Engagement metrics that indicate real buyer interest
Deliverability gets you into the inbox. Engagement metrics tell you whether your message resonates enough to start a conversation.
Reply rate
Reply rate is your truest engagement indicator, calculated as: (Unique Human Replies / Delivered Emails) × 100. Exclude auto-replies, out-of-office notices, and bounce notifications, and count each recipient only once even if they send multiple messages. A "not interested" reply still counts because it confirms a human read your message and took action.
Average reply rates dropped to 5.8% in 2024 from 6.8% the previous year.A good B2B cold email reply rate is 5-10%, with top performers hitting 15% on tightly targeted campaigns. If your reply rate stays below 2%, your targeting or copy needs immediate attention.
"The most helpful part is the detailed reporting. It shows clear data like open rates, replies, and bounce rates, which I can easily use for analysis." - Anjali T. on G2
Interested rate (positive reply rate)
Not all replies signal buying interest. Positive reply rate measures qualified responses showing genuine interest rather than objections or opt-outs, calculated as: (Positive Replies / Total Replies) × 100. Our Unibox feature uses AI Custom Reply Labels to automatically categorize responses as "Interested," "Not Interested," "Meeting Booked," and other custom tags. You can manually adjust labels and track interested rate in the Campaign Pipeline Analytics view. This metric bridges engagement and revenue by isolating replies that can convert to meetings.
Click-to-open rate (CTOR)
We prefer CTOR over standard CTR becauseit isolates your email body performancefrom subject line and deliverability variables: (Unique Clicks / Unique Opens) × 100. If your open rate is high but CTOR is low, your email body does not deliver on the subject line promise. A CTOR above 20% indicates strong engagement, while the cross-industry average sits around 11%. Track CTOR by link within our analytics to see which calls-to-action drive the most interest.
Revenue metrics: Connecting cold email to pipeline
Sales leaders get judged on closed deals, not email activity. Revenue metrics tie your outreach efforts directly to pipeline generation and budget justification.
Meetings booked
Meetings booked is the ultimate SDR outcome metric. Track meetings as a percentage of delivered emails: (Meetings Booked / Delivered Emails) × 100. Strong campaigns generate 1-3% meeting rates from delivered emails. If you deliver 1,000 messages, expect 10-30 meetings with proper targeting, verified data, and relevant messaging.
Our Campaign Pipeline Analytics tracks opportunities, conversions, and revenue alongside meetings booked. You can filter by campaign and label meetings by source message or sequence step to identify which follow-ups drive the most conversions. Watch how to book 200 sales calls a month for a detailed campaign breakdown from a power user.
"Love how Instantly can warm up email domains, taking away all that manual work. Its also super easy to set up campaigns and integrates with Clay so I can just push my contacts from directly from Clay to instantly." - Holly B. on G2
Cost-per-meeting
Cost-per-meeting (CPM) divides total outbound costs by meetings booked. Calculate monthly: (Software + Data + Labor) / Meetings Booked. Software costs include your cold email platform subscription and any lead database tools.Data costs cover contact verification and domain infrastructure. Labor costs account for list research, copy creation, and campaign management time.
Example: Your Growth plan costs $37/month, SuperSearch costs $47/month, domains and email accounts cost $200/month, and you spend 20 hours managing campaigns at $40/hour ($800 labor). Total monthly cost: $37 + $47 + $200 + $800 = $1,084. If you book 8 meetings, CPM = $1,084 / 8 = $135.50 per meeting.
A strong B2B CPM ranges from $50-$150 depending on deal size and industry.Cold email delivers 18x lower cost per meeting($152.73) compared to cold calling ($2,777.78). Our flat-fee unlimited accounts model keeps your software costs fixed as you scale, improving CPM as meeting volume grows without per-seat penalties.
SQL conversion rate
Sales Qualified Leads (SQLs) are prospects vetted through specific criteria indicating strong likelihood of converting to paying customers. Your sales team accepts these leads as ready for direct follow-up. Track SQL conversion from meetings: (SQLs / Total Meetings Booked) × 100. Poor SQL conversion suggests misalignment between SDR targeting and sales team qualification standards, or weak discovery during initial meetings.
Connect our campaigns to your CRM using native integrations and webhooks to track the full funnel from delivered email through SQL and closed-won stages. This attribution clarity helps you defend outbound budgets and identify which campaigns generate qualified pipeline rather than just activity.
B2B email sequence benchmarks: What good looks like in 2026
Average cold email open rates dropped from 36% in 2023 to 27.7% in 2024, andby 2025 a 15-25% open rate is acceptable for cold B2B campaigns, though Apple MPP inflation means this number is directional at best.
Here are realistic 2026 benchmarks for B2B cold email sequences using verified contact data and warmed domains:
Metric | Poor | Average | Excellent |
|---|---|---|---|
Bounce Rate | >5% | 2-5% | <2% |
Open Rate (directional) | <20% | 25-40% | >50% |
Reply Rate | <2% | 5-8% | >10% |
Typical cold email response rates range from 1-5%, withindustry studies showing average reply rates of 5.1% in 2024. If your campaigns consistently hit 8-10% reply rates, you are in the top quartile for targeting and message-market fit. Prioritize month-over-month improvement trends over single-campaign snapshots, since seasonal factors and list source quality create variance.
How to set up a measurement plan for your sales team
Sales leaders need repeatable processes, not one-off campaign reports. A weekly measurement plan standardizes what you track, when you review it, and what thresholds trigger intervention.
Step 1: Define your goal with inputs and constraints
Set specific, measurable targets tied to pipeline needs. Example goal: Book 12 qualified meetings per month at under $120 CPM using 3 warmed domains with 9 total email accounts, 1,200 verified contacts per month, and two sequence variants for A/Z testing. Link goals to business outcomes by working backward from revenue targets to set realistic meeting volume goals.
Step 2: Establish your baseline across all metrics
Measure current performance for two weeks across delivered emails, reply types (positive, neutral, negative, auto-reply), meetings booked, bounce rates, and cost inputs. Your baseline shows where to focus optimization. If bounce rates are already under 2% but reply rates are 3%, improve targeting and copy before adding volume.
Step 3: Set your review cadence and assign ownership
Run a 30-minute weekly ops review every Monday morning:
- Dashboard metrics: Review delivered, bounced, replied, interested, and meetings booked.
- Campaign performance: Identify best and worst performing campaigns by reply rate and interested rate.
- Domain health: Check health scores and warmup status for all accounts.
- Reply analysis: Analyze positive vs. negative reply ratios by sequence step.
- Cost trends: Calculate cost per meeting trend (current week vs. prior four-week average).
- Testing: Launch new A/Z test variations based on previous results.
Assign one person (RevOps or Sales Ops) to prepare the weekly report. Use a consistent analysis window (7, 14, or 30 days after send) to keep comparisons fair.
"I really enjoy using Instantly for a variety of reasons. Its simplicity in managing inboxes and campaigns stood out immediately... The automation of outreach and centralized inbox management means that I can handle multiple domains, track performance in real time, and manage warm-up processes efficiently." - Nathan D. on G2
Step 4: Define red flags and pause protocols
Create automatic pause triggers to protect domain reputation:
- Bounce rate >5%: Immediate pause. Instantly automatically pauses campaigns when bounce rates exceed 5%. Re-verify list, check DNS records, remove hard bounces.
- Reply rate drops below 5%: Copy or targeting issue. Pause, review message relevance, check for spam trigger words.
- Spam complaints above 0.3%: Major deliverability risk. Pause, audit list source and opt-in quality, improve unsubscribe visibility.
- Domain health score drops below 80: Slow sends by 50%, increase warmup ratio, review engagement metrics.
Document your pause protocol and share it with the full team so anyone monitoring campaigns can act fast. Quick pauses prevent small issues from becoming blacklist events that take weeks to resolve. Check out these tips before starting cold email for common mistakes that trigger deliverability crises.
Using Instantly to track and improve sequence performance
We consolidate deliverability monitoring, campaign analytics, and reply management into one dashboard, giving you the truth-source needed to defend your numbers to leadership.
Real-time analytics dashboard
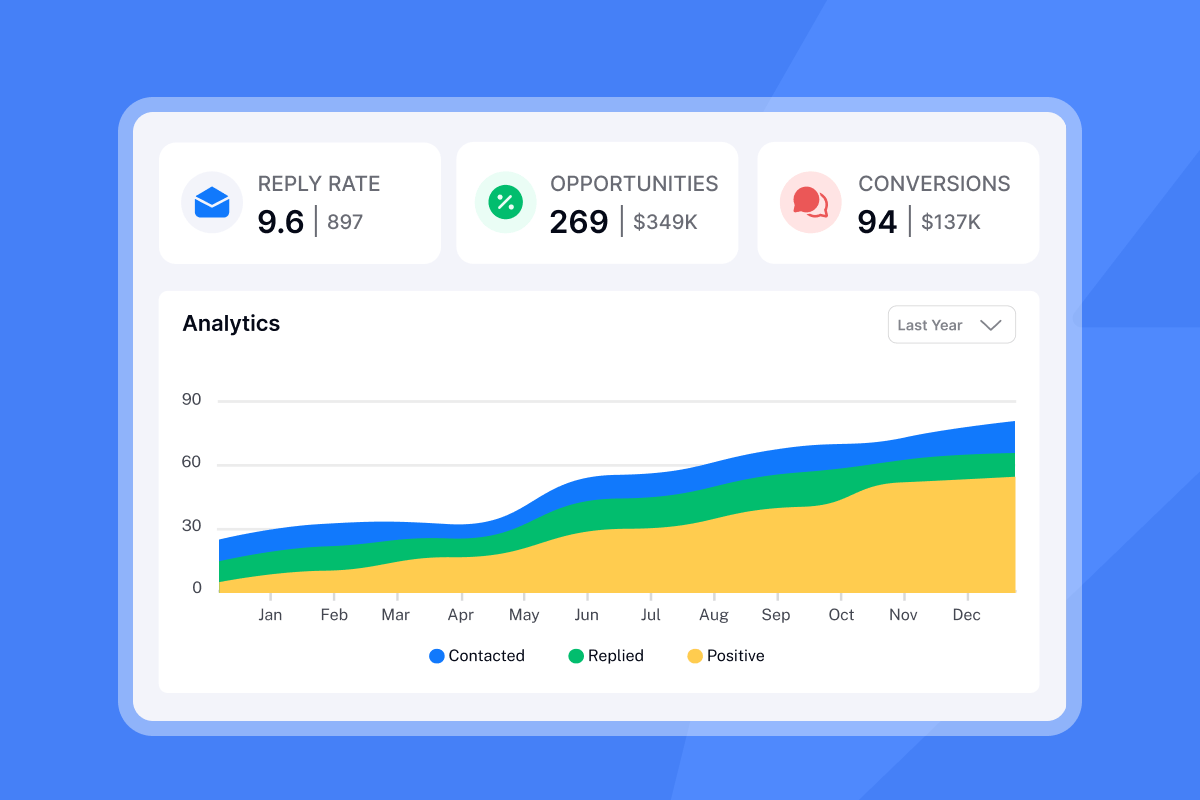
Our analytics dashboard tracks campaign performance with filtering by campaign, date range, and email account. Navigate to the Analytics tab within any campaign to see open rates, click rates, opportunities, and conversions. We track multiple email accounts and deliverability rates in one view, so you can compare inbox-level performance and identify accounts with declining health before they impact overall results.
"Deliverability tools that actually move the needle: warmup, inbox rotation, and smart sending windows help us land in Primary instead of Promotions/Spam." - Anthony V. on G2
A/Z testing and variant analysis
Our A/Z testing feature (available on the Hypergrowth plan at $97/month) lets you test email variants within a single campaign. Set up multiple versions of your subject line or opening paragraph, define the split percentage, and track which variant generates higher reply rates and interested responses. The A/Z test results view shows performance side-by-side. After 200-300 sends per variant, you have enough data to confidently scale the winner. Watch the detailed walkthrough from "I Studied 1,000,000 Cold Emails" to see how top performers structure their testing programs.
Unified inbox with AI reply labels
Our Unibox centralizes hundreds of email accounts into one reply interface, saving hours of manual inbox switching. AI Custom Reply Labels automatically tag responses as "Interested," "Not Interested," "Meeting Booked," or custom categories you define, ensuring consistent categorization across team members. You can manually adjust labels when AI miscategorizes a response, and all labels feed into the Campaign Pipeline Analytics for accurate interested rate and meeting conversion tracking.
Deliverability and warmup monitoring
The email accounts tab shows warmup status and domain health for each connected inbox. Green flame icons indicate active warmup with health scores above 90, while yellow or red flames signal reputation issues requiring attention. Enable warmup before launching campaigns and maintain it continuously, even while sending, to balance outbound volume with engagement signals that protect your domains.
Advanced warmup options (weekday-only sending, read emulation, open rate simulation, reply rate targets) help new domains build reputation faster and give established domains consistent engagement patterns that mailbox providers trust.
The scorecard that keeps campaigns healthy
Consistency beats intensity in cold email performance. A sales leader running five campaigns with weekly measurement and quick optimization will outperform someone launching 20 campaigns and checking them monthly.
Your measurement plan should answer three questions every Monday morning: Can I still land in inboxes (deliverability health), are the right people responding (engagement quality), and are responses turning into pipeline (revenue outcomes). When any layer shows red flags, pause and fix the root cause before scaling sends.
Track month-over-month trends in reply rate, interested rate, and cost-per-meeting rather than obsessing over individual campaign snapshots. Your goal is consistent improvement and protection of domain reputation, not perfect performance on every campaign.
Use our analytics to compare campaigns and identify your winners, then document what made them successful (list source, message angle, sending schedule, sequence steps) in a playbook your team can replicate. The fastest path to predictable pipeline is running three proven campaigns repeatedly, not constantly testing new approaches without learning from previous results.
Ready to track the metrics that actually matter? Try Instantly free and access deliverability monitoring, campaign analytics, and reply management in one platform. Which metric will you check first tomorrow: bounce rate, reply rate, or cost-per-meeting?
Frequently asked questions
What is a good open rate for cold email?15-25% is acceptable for B2B cold campaigns in 2025, though Apple MPP inflates these numbers significantly. Focus on reply rates instead, as open rates are no longer reliable for measuring true engagement.
How do I calculate email reply rate accurately?(Unique human replies / Delivered emails) × 100, where delivered equals sent minus total bounces (hard and soft). Exclude auto-replies, out-of-office messages, and count each recipient only once.
What is the difference between bounce rate and deliverability rate? Bounce rate measures emails returned as undeliverable divided by total sent.Deliverability rate measures emails that reached recipient servers(sent minus bounces divided by sent). Deliverability does not guarantee inbox placement, only server acceptance.
How often should I check my email sequence metrics? Review deliverability and domain health daily using quick dashboard checks. Conduct full performance analysis weekly with your team to identify trends, pause underperforming campaigns, and scale winners.
Key terms glossary
Deliverability Rate:The percentage of emails that successfully reach the recipient's server, calculated as ((Sent - Bounces) / Sent) × 100. Does not guarantee inbox placement, only server acceptance.
Hard Bounce:Permanent delivery failure due to invalid addresses, blocked servers, or blacklisted domains. Remove hard bounces immediately from your list to protect sender reputation.
Soft Bounce: Temporary delivery failure from full inboxes or momentary server issues. Monitor soft bounces over three attempts before marking as invalid.
CTOR (Click-to-Open Rate):(Unique clicks / Unique opens) × 100. Measures content relevance after someone opens, isolating body performance from subject line effectiveness.
Interested Rate: Percentage of responses showing genuine buying interest rather than objections or opt-outs. Track positive replies in Campaign Pipeline Analytics to bridge engagement and revenue metrics.
SQL (Sales Qualified Lead):A prospect vetted through specific criteria indicating strong likelihood of conversion. Your sales team accepts these as ready for direct follow-up and qualification calls.
Spin Syntax: Variations of text used to improve deliverability by making each email appear unique to spam filters. Typically rotates words, phrases, or sentences across sends.


