Updated June 9, 2026
TL;DR:
This ROI calculator takes inputs across team size, SDR cost, deal size, and tool spend to produce five outputs: cost-per-meeting, monthly pipeline generated, payback period, annual ROI, and time reclaimed per rep. The platform-wide average cold email reply rate on Instantly.ai sits at 3.43%, with top-quartile teams reaching 5.5% and elite performers exceeding 10%. The formulas, defaults, and a downloadable Excel template are below, along with how Instantly's dashboards give you the exact data points you need to run the model with real numbers, not guesses.
Most sales leaders running a 5-15 rep team spend north of $90,000 per fully-loaded SDR annually once you factor in base salary, benefits, tooling, training, and management overhead. An AI Sales Agent runs on Instantly Credits starting at $9 per month, with a free trial also available. The gap between those two numbers is where your business case lives, and this calculator shows you exactly how wide that gap is for your team.
What the AI sales agent ROI calculator measures
You get five outputs from your inputs, each answering a question your CFO or VP of Sales will ask before approving budget.
Output | The question it answers |
|---|---|
Cost-per-meeting (CPM) | What does each booked meeting actually cost us? |
Monthly pipeline generated | What is the revenue opportunity from this investment? |
Payback period | How many months until this pays for itself? |
Annual ROI | What is the return on a 12-month commitment? |
Time reclaimed per rep | How many hours per week shift from admin to selling? |
Run the model before deployment to set expectations. Run it again at 30, 60, and 90 days with actuals from your campaign analytics to track whether you are hitting, missing, or beating the forecast.
Calculator inputs and default benchmarks
The calculator uses two categories of inputs: your team's actual cost structure and published performance benchmarks. Enter your own numbers where you have them. Where you don't, the defaults below come from platform-wide Instantly data and published B2B sales research. Replace every default with actuals as soon as your first 30 days of campaign data is available.
Team and cost inputs
Enter these numbers for your team:
- Number of SDRs or reps: How many people currently run outbound.
- Fully-loaded SDR cost per year: Industry data puts the average at roughly $95,000-$128,000 per year (base around $50,000 plus benefits, tooling, training, and management overhead). First-year cost can reach $139,000 when you include ramp time.
- Average ramp time in months: Most SDRs take an average of 3.2 months to reach full productivity, meaning you pay for weeks of output you have not yet received.
- Monthly tool cost (current): Add up CRM, data, sequencing, and enrichment tools. A fully functional outbound stack combining CRM, data sourcing, sequencing, and enrichment tools often reaches $300 to $500 per month before you send your first email.
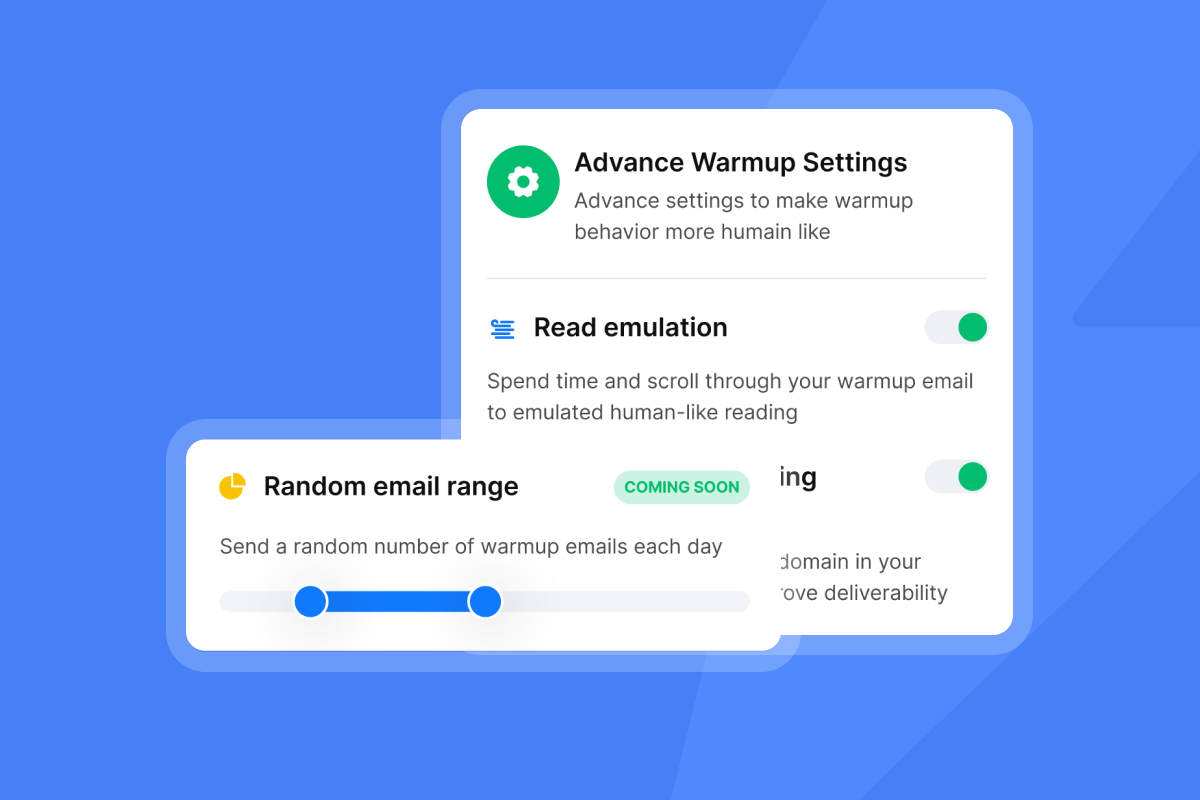
- Instantly monthly cost: The Growth Outreach plan starts at $47 per month and includes unlimited email accounts and warmup. Add Instantly Credits (starting at $9 per month) to power the AI Sales Agent, AI Reply Agent, and SuperSearch. A starter stack combining Growth Outreach, Credits, and CRM runs about $141 per month.
Performance benchmarks
Use these defaults if you do not yet have your own data. Override every one of them once you have actuals from your campaigns.
Metric | Platform average | Top quartile | Elite |
|---|---|---|---|
Cold email reply rate | 3.43% | 5.5% | 10%+ |
Meeting booking rate (illustrative)*** | no independent benchmark*** | ~1.5% | 2.34% |
Meeting-to-opportunity rate* | ~50% | 55% | ~60%+ |
Opportunity-to-close rate** | 20-30% | 31-35% | 39-45% |
Ramp reduction with AI (estimated)††† | ~10% | ~20% | ~35% |
*Meeting-to-opportunity rate benchmarks are illustrative and vary widely by ICP, deal quality, and qualification process. The ~50% platform average is a directional estimate only. No published benchmark directly documents this figure at the platform level. Override all three values with your own CRM data before presenting this model.
**Opportunity-to-close rate benchmarks vary widely by deal size and segment. B2B SaaS mid-market deals ($50K-$100K) typically show 25-35% win rates, while smaller deals under $50K can reach 35-45%. Enterprise deals above $100K often fall below 25%. The figures above represent a blended mid-market range. Use your last 12 months of CRM data as your primary input.
***Meeting booking rate benchmarks are illustrative and vary by hook type, ICP, and send volume. No independently citable primary source documents a platform-wide average meeting booking rate. The ~0.8% figure circulates in vendor-aggregated summaries but cannot be traced to a published study or audited dataset. The top-quartile figure of ~1.5% sits at the lower bound of the 1.5-4% outbound sequence-to-meeting range documented by Prospeo. The elite figure of 2.34% is a directional estimate within that same range. Callbox's 2026 Managed Cloud Outreach Report cites 2.5% as an elite managed outreach benchmark. Override all three with your own campaign data once you have 30 days of actuals.
†††Ramp reduction percentages are illustrative estimates. No published benchmark documents a platform-wide average of 10% or a top-quartile figure of 20% for AI-assisted outbound specifically. Published case studies from AI sales training programs cite ramp reductions of 35-70%, which suggests the ~20% top-quartile figure in this table is conservative relative to reported outcomes. The ~35% elite figure aligns with the lower bound of documented case study results. All three figures vary by team structure, manager support, tool adoption rate, and whether ramp reduction is measured by quota attainment or activity volume. Treat all three as directional anchors and track your own ramp time before and after deployment to establish a team-specific baseline.
The platform-wide average reply rate sits at 3.43%, with top-quartile teams reaching 5.5% and elite performers exceeding 10% on tightly targeted campaigns. You should target 5% or higher for B2B cold email and treat anything below 1% as a warning that list hygiene or copy needs work. The cold email copywriting framework from Instantly covers the copy levers that move reply rates from average to excellent.
Revenue variables
- Average contract value (ACV): Your average deal size in dollars.
- Average sales cycle in days: B2B SaaS deals typically close in 84 days, though SMB deals can close in 18 days and enterprise deals can stretch to 160 days. Use your own CRM data if you have it.
- Pipeline-to-quota ratio: A common target is 3:1, meaning you need three dollars of pipeline for every dollar of quota. This determines how many meetings you need each month to hit plan.
The formulas behind the calculator
Four formulas drive every output in the model. Each one maps directly to a question your CFO or VP of Sales will ask. The sections below show the formula, the inputs it needs, and a worked example using the $141 per month starter stack so you can sanity-check your own numbers before you open the template.
Cost-per-meeting formula
Cost-per-meeting is the single number that lands hardest in a CFO conversation because it makes the comparison between a human SDR and an AI agent concrete.
Formula:
Cost-per-meeting = Total monthly outbound cost / Meetings booked per month
Total monthly outbound cost includes pro-rated SDR salary, tools, and overhead. If one SDR costs $7,500 per month all-in and books 15 meetings per month, cost-per-meeting is $500. The Instantly starter stack at $141 per month changes that denominator materially, because the AI handles prospecting, sequencing, and initial reply handling while the rep focuses on live conversations.
For the Instantly model, your monthly cost is the sum of your Outreach plan, Instantly Credits subscription, and CRM add-on. On the starter stack ($141 per month for Outreach Growth, Instantly Credits Growth and CRM Growth), if the AI Sales Agent books 20 meetings in a month, you hit a CPM of $7.05. Even at lower volumes, the economics make a strong case.
Pipeline value formula
Monthly pipeline = Meetings booked × Meeting-to-opportunity rate × ACV
Use your CRM meeting-to-opportunity rate or start with the ~50% platform-average figure. If your team qualifies meetings tightly, the 55% high-performer benchmark is a reasonable stretch target. A team booking 30 meetings per month at 55% conversion and a $25,000 ACV generates $412,500 in monthly pipeline. At those inputs ($412,500 per month), a 12-month run rate puts annual pipeline from this single channel at just under $5 million.
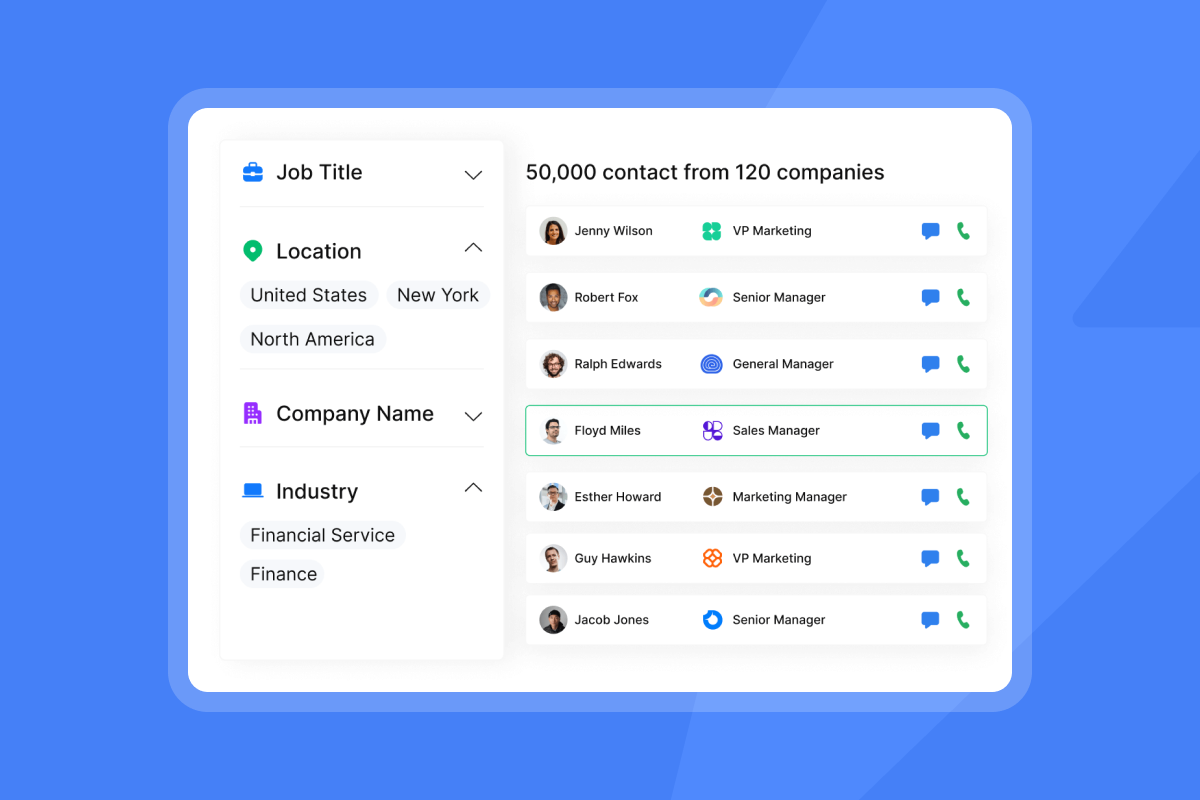
The AI Sales Agent searches the 450M+ B2B contact database inside SuperSearch, enriches each lead with verified firmographic data, writes personalized outreach, runs follow-up sequences automatically, and passes interested replies to the AI Reply Agent for handling in under five minutes. That full cycle runs without a rep touching it until a meeting is booked. Watch the complete workflow in this overview:
Watch this AI Sales Agent demo from the Instantly team to see the full process from lead sourcing through meeting booking.
Payback period formula
Because the Instantly starter stack costs $141 per month and monthly pipeline value at even the platform-average scenario runs into six figures, tool-cost recovery is near-instant. The more meaningful question for a CFO is: how many months until AI-sourced meetings generate enough closed revenue to cover your annual tool investment? That depends primarily on three variables: meetings booked, close rate, and sales cycle length.
Formula:
Payback period (months) = MonthlyAnnual tool cost / (Monthly closed revenue from AI-sourced meetings)

Where:
Monthly closed revenue = (Meetings booked per month × ACV × closeMeeting-to-opportunity rate × gross margin)
Payback period (months)Close rate × ACV) ÷ Sales cycle in months
Annual tool cost = Monthly Instantly subscription × 12
At platform-average inputs: $141 × 12 = $1,692 annual cost. Monthly closed revenue = (10 × 0.55 × 0.22 × $25,000) ÷ 2.8 months = approximately $10,804 per month once deals begin closing. Payback on annual tool spend: $1,692 ÷ $10,804 = under one month of closed revenue. The limiting factor is not cost recovery. It is sales cycle length. If your average deal closes in 84 days, your first AI-sourced revenue arrives roughly three months after launch. That is the timeline to communicate to your CFO, not tool-cost recovery, which happens inside the first closed deal.
How quickly you ramp volume and tighten targeting drives your payback timeline most directly. The guide on scaling with secondary sending domains covers the infrastructure setup that makes faster ramp possible.
Annual ROI formula
Annual ROI = (Net gain from investment - Cost of investment) / Cost of investment × 100
Net gain is the revenue closed from meetings generated by the AI agent. Cost of investment is your 12-month tool spend. If your $141 per month stack ($1,692 per year) helps close $50,000 in new revenue, your annual ROI is 2,854%. Even at more conservative close rates and smaller deal sizes, the ROI multiple on a $47 to $97 per month outreach plan is structurally strong because the denominator is very low compared to a human SDR. The ROI model is calculable from documented inputs: a functional starter stack runs $141 per month (Outreach Growth + Credits Growth + CRM), not the base $47 per month figure. Run the formulas above against your own ACV and close rate to get a number you can defend, not an estimate based on the lowest advertised price.

Sensitivity analysis: three illustrative scenarios
Run all three scenarios before presenting to your CFO. This shows you understand the risk distribution and have not cherry-picked a best-case number. All outputs below are illustrative, derived from the stated assumptions. Override every input in the downloadable template with your own data.
Scenario | Reply rate | Meetings/month | CPM | Annual pipeline | Months to first closed revenue |
|---|---|---|---|---|---|
Platform average (illustrative) | 3.43% | ~10 | $14.10† | $1.65M† | ~3 months† |
Top quartile (illustrative) | 5.5% | ~20‡ | $7.05# | $3.30M‡ | ~2 months^ |
Elite (illustrative) | 10%+ | ~40+¶ | $3.53‖ | $6.60M+¶ | ~1 month§ |
Illustrative assumptions: $141/month Instantly starter stack, 55% meeting-to-opportunity rate, example ACV of $25,000 (mid-market illustration only. Horizontal SaaS medians typically run $8K-$15K, Vertical SaaS $25K-$50K), 22% close rate. Months to first closed revenue reflects the approximate time from AI-sourced meeting to closed deal based on sales cycle length, not tool-cost recovery. Tool-cost recovery occurs within the first closed deal at all three scenarios given the $141/month stack. Replace ACV with your own CRM data before presenting this model.
†Meetings per month, CPM, annual pipeline, and months to first closed revenue for the platform average scenario are illustrative. The ~10 meetings/month figure is derived proportionally from the 3.43% platform-wide reply rate and is not a documented per-team average. The $14.10 CPM is calculated from the $141/month starter stack divided by ~10 meetings per month and is not a published external benchmark.
The $1.65M annual pipeline figure is calculated from ~10 meetings per month multiplied by the 55% meeting-to-opportunity rate, example ACV of $25,000, and 12 months, and is not a published external benchmark. Months to first closed revenue is driven primarily by sales cycle length, not tool cost. At an 84-day average B2B sales cycle, the first AI-sourced meetings booked in month one generate closed revenue in approximately month three. Tool-cost recovery occurs within the first closed deal.
Use the 12-month projection tab in the downloadable template to model your specific sales cycle. Actual meeting volume depends on contact list size, send volume, and sequence structure. Actual CPM and pipeline depend on your plan cost, contact list quality, achieved reply rate, ACV, and close rate.
‡Meetings per month and annual pipeline for the top quartile scenario are illustrative, derived proportionally from the 5.5% reply rate benchmark and platform average inputs. Actual meeting volume and pipeline depend on contact list size, send volume, sequence structure, ACV, and close rate. Override all inputs in the downloadable template with your own campaign data.
§Months to first closed revenue for the elite scenario reflects a sub-30-day close cycle consistent with SMB deals and tightly targeted campaigns. Enterprise deals above $100K typically run 120 to 160 days regardless of reply rate. Model your own sales cycle in the 12-month projection tab before presenting this scenario.
¶Meetings per month and annual pipeline for the elite scenario are illustrative, scaled proportionally from the platform average inputs. Published industry benchmarks show top-performing outbound SDRs book significantly fewer meetings per month than the ~40+ figure in this scenario. The ~40+ figure represents a best-case, tightly targeted AI-assisted scenario and is not a typical outcome. Actual meeting volume and pipeline depend on contact list size, send volume, sequence structure, ACV, and close rate. Override all inputs in the downloadable template with your own campaign data before presenting this scenario.
‖CPM for the elite scenario is illustrative, calculated from the $141/month starter stack divided by ~40 meetings per month. Actual CPM depends on your plan cost, contact list quality, send volume, and achieved reply rate. Pay-per-meeting vendors typically charge $100-$500 per appointment for SMB and mid-market deals. Use the Formulas tab in the downloadable template to calculate CPM from your own cost and meeting volume inputs.
^Months to first closed revenue for the top-quartile scenario reflects a faster qualification cycle at higher meeting volume. Actual timing depends on your sales cycle length. Use the 12-month projection tab to model your specific inputs.
Use the platform-average scenario in your board deck. If you hit top-quartile or elite performance, the upside takes care of itself. The platform-average case still shows a payback period well within your fiscal year.
Sales cycle length is the variable that shifts payback the most. If your average deal closes in 18 days (SMB), you will see cash from AI-sourced pipeline inside your first quarter. If you sell enterprise with 160-day cycles, you will see pipeline build immediately but closed revenue later. Make sure your CFO understands that distinction when reviewing the model.
One additional risk to model: deliverability. When you let unverified contacts push bounces above 2%, you damage sender reputation and reduce effective meeting volume. Keep bounces under 2% and use automated inbox placement tests to monitor where your email lands before you scale volume. Add a "deliverability impairment" scenario that cuts meeting volume substantially to show what happens if hygiene slips.
How Instantly's dashboards provide the data points you need
Every formula in the model is only as accurate as the data you feed it. This section covers the three dashboard areas that supply those inputs: campaign analytics for reply and meeting data, the AI Reply Agent for conversion tracking, and the pricing structure that keeps your cost inputs predictable month to month.
Transparent reporting that feeds the model
Bad input data breaks most ROI models. If your reporting tool misclassifies replies or mislabels pipeline stages, you calculate CPM wrong from the start.
Instantly's campaign analytics tracks reply rates, opportunity creation, and campaign performance metrics so you can pull real numbers into the ROI template rather than relying on benchmarks. One G2 reviewer captures this directly:
"The automation for inbox rotation, warm up and sending limits makes outreach very smooth and saves a lot of manual work. The most helpful part is the detailed reporting. It shows clear data like open rates, replies, and bounce rates, which makes performance tracking very transparent and data-driven." - Anjali T. on G2
You feed that data directly into your cost-per-meeting calculation. Pull your actual replies and meetings from the dashboard, divide by your monthly spend, and bring a CPM number your CFO can verify in the tool.
AI Reply Agent and meeting conversion
The AI Reply Agent handles incoming replies in under five minutes, classifies intent as interested, not interested, out of office, or requesting more information, and moves leads to the correct pipeline stage in your CRM. It runs in Human-in-the-Loop mode (you approve each response) or Autopilot mode (it handles replies end-to-end). This feature consumes five Instantly Credits per reply, billed through a separate Credits subscription.
The meeting conversion rate in your ROI model improves when reply handling is faster. Most meetings book after the second or third touchpoint, not the first. When the AI handles those touchpoints in under five minutes while your rep is on another call, you increase your effective meeting booking rate. The help doc on turning interested leads into meetings covers the exact follow-up logic that drives this.
"What stands out to me most is the amazing AI reply agent. It significantly simplifies our tasks by generating very accurate messages that I only need to review, thereby enhancing our efficiency in engaging with long-term leads across various prospects." - Anne S. on G2
For a broader look at scaling your AI-assisted outbound system, watch this beginner walkthrough covering setup through optimization:
Watch the 2026 cold email setup guide from Vincent Robin to see the full Instantly configuration from scratch.
Predictable pricing and clear ROI forecasting
One of the biggest drivers of ROI model accuracy is how well you can predict cost. Per-seat pricing models from legacy suites add friction as you scale because you pay more with every new hire. Instantly uses a flat-fee model for outreach: one monthly price for unlimited email accounts and warmup, regardless of how many inboxes you connect.
The Instantly Credits model is consumption-based (five credits per AI reply, five credits per AI-sourced lead), but you can forecast credit spend by estimating monthly reply volume and lead sourcing targets. With plans starting at $9 per month and a fixed credit rate per action, you can estimate your monthly spend before the billing cycle closes.
The rotating IP and sending algorithm guide explains the deliverability infrastructure that protects your sender reputation as volume increases, which protects your meeting volume and therefore your ROI model.
Download the ROI calculator template
The template is structured with five tabs:
Build your own model in any spreadsheet tool using five tabs:
- Inputs: Team size, fully-loaded SDR cost, Instantly monthly cost, and ACV.
- Benchmarks: Platform average, top-quartile, and elite defaults from this article, with space to override each one with your own data.
- Formulas: Manual calculations for CPM, monthly pipeline, payback period, and annual ROI using the formulas in the section above.
- Sensitivity analysis: Duplicate the formulas tab and adjust reply rate and close rate inputs to run the three scenarios from the table above.
- 12-month projection: A month-by-month pipeline and revenue chart that accounts for your sales cycle length.
How to interpret your results
If your payback period is under six months: You have a strong business case and should move to a 30-day pilot. Lock in specific meeting targets (for example, 15 additional meetings in month one) and track actuals against the model weekly.
If your payback period is 6 to 12 months: Your case still holds but depends on accurate close rates. Pressure-test your opportunity-to-close rate with your last 12 months of CRM data before presenting to your CFO.
If your payback period exceeds 12 months: Check two things. First, verify your ACV and close rate inputs are accurate, not aspirational. Second, look at your reply rate assumption. Moving from 3.43% to 5.5% replies can more than double meeting volume and cut payback roughly in half. The Instantly prompt library has copy frameworks specifically designed to improve reply rates on common B2B use cases.
If your CPM is above $200: You are likely underestimating meeting volume or running too few contacts. The AI Sales Agent sources leads directly from the 450M+ SuperSearch database and enriches them automatically, which reduces the lead sourcing cost that often inflates CPM on manual outbound.
On ramp time: You pay full salary for partial output during every month of SDR ramp. If the AI Sales Agent reduces effective ramp by 20 to 35%, you capture that saving in your first-year ROI, not your steady-state model. Include it as a separate line item when you present to finance.
Teams that approach this with clear inputs, honest benchmarks, and a defined 30-day checkpoint produce the strongest outcomes: more meetings booked, lower cost-per-meeting, and a CFO who trusts the number because it came from real data in a real dashboard.
For a broader look at how AI agents compare across the 2026 sales stack, see the Instantly vs. Apollo comparison for context on how deliverability infrastructure and pricing models affect real-world ROI.
Try Instantly free and bring your first real CPM number to your next pipeline review instead of a benchmark estimate.
FAQs
What is a good cost-per-meeting benchmark for cold email outreach?
On the $141 per month Instantly starter stack, the sensitivity analysis table shows CPM landing at $14.10 at platform-average reply rates (3.43%, ~10 meetings per month) and $7.05 at top-quartile reply rates (5.5%, ~20 meetings per month). Industry CPM varies widely by ICP, deal size, and send volume, so use these as directional anchors, not hard targets. If your CPM is climbing above what your ACV supports, check two things: list quality and send volume. Low reply rates inflate CPM faster than any other variable.
How long does it take to see ROI from an AI sales agent?
Revenue-linked ROI depends on your sales cycle length, with SMB teams often closing AI-sourced pipeline within the same quarter and enterprise teams seeing closed revenue in 2 to 3 quarters. Use the 12-month projection tab in the template to model both scenarios before committing to a timeline in your budget presentation.
How much does it cost to run an AI sales agent on Instantly?
The AI Sales Agent runs on Instantly Credits, a separate subscription from the Outreach plan, starting at $9 per month for 150 credits and scaling to $197 per month for 10,000 to 200,000 credits. A starter stack combining Outreach Growth ($47), Credits Growth ($47), and Growth CRM ($47) runs $141 per month.
What reply rate should I use as a default in the ROI calculator?
Use the platform average of 3.43% as your conservative default and 5.5% (top quartile) as your median target, based on Instantly's cold email benchmark data. Anything below 1% means your list quality or copy needs attention before you scale volume.
Does the ROI calculator account for deliverability risk?
The sensitivity analysis tab in the downloadable template includes a deliverability impairment scenario that models a meaningful reduction in meeting volume to show what happens if bounce rates climb above 2%. Instantly's inbox placement testing and the built-in warmup network give you early warning signals before a deliverability issue cuts into your actual meeting volume.
Key terms glossary
Cost-per-meeting (CPM): Total monthly outbound cost divided by meetings booked. The primary number for comparing human SDR economics to AI agent economics.
Payback period: For outbound tools with low monthly cost, there are two distinct payback concepts. Tool-cost payback is the number of months of subscription fees recovered by closed revenue. At $141 per month, this occurs within the first closed deal at any scenario in this model. Revenue-cycle payback is the number of months from campaign launch to first closed revenue, driven primarily by sales cycle length, not tool cost. The sensitivity table uses revenue-cycle payback. Communicate both to your CFO and make clear which one you are presenting.
Pipeline-to-quota ratio: The multiple of pipeline dollars required to hit revenue quota. Standard B2B target is 3:1, meaning three dollars of pipeline for every dollar of quota.
Meeting-to-opportunity rate: Percentage of booked meetings that advance to a qualified opportunity stage. Available benchmark data suggests platform-average conversion sits around 50%, with high performers reaching 55-62% (Gradient Works). Treat 55% as a high-performer directional anchor, not a median. Use your own CRM data to set the target for your team.
Fully-loaded SDR cost: Total cost of a sales development rep including salary, benefits, tooling, training, and management overhead. Industry data puts the average at roughly $95,000-$128,000 per year, with first-year costs reaching $139,000 when ramp time is included.
Instantly Credits: A separate subscription that powers the AI Sales Agent (5 credits per generated lead), AI Reply Agent (5 credits per reply), and SuperSearch lookups. Plans start at $9 per month for 150 credits.
SISR (Server and IP Sharding and Rotation): Instantly's dedicated private server and IP pool technology, available on the Light Speed plan ($358 per month), designed to protect sender reputation at high send volumes.
Read next
- Instantly pricing and ROI: how to calculate the real cost of your outbound stack and build a defensible budget case before you commit.
- Decision-maker prospecting ROI: how to calculate cost-per-meeting for B2B outbound and benchmark it against your ACV.
- Cold email features that drive ROI: which cold email features actually move reply rates and pipeline, and which ones are marketing noise.