Updated: May 15, 2026
TL;DR
Open rates are a false signal for decision-maker campaigns. Track positive reply rate, contact reach rate by role, and conversation-to-meeting rate instead. C-level executives reply to cold email at a 6.4% total rate, but build pipeline forecasts on positive reply rate, which is roughly 40-60% of total replies after filtering neutral and negative responses. According to Gong's analysis of 1.8 million opportunities, multi-threaded accounts with 3 or more contacts engaged close 2.4x faster than single-contact deals, making account penetration depth a critical KPI. Set attribution windows to match your sales cycle length so you see actual returns, not a 30-day snapshot of a 90-day process. Unify outreach analytics, reply classification, and CRM pipeline in one dashboard so every number you report traces back to a single source of truth.
Most B2B teams track open rates, yet the revenue impact of decision-maker outreach comes from multi-threaded account engagement that standard email metrics miss entirely. If your team books meetings with the wrong roles, your pipeline velocity stalls, your forecast looks healthy, and your CFO asks why closed-won revenue is flat. Measuring prospecting success starts with tracking the right KPIs, from contact reach rate by role to multi-touch revenue attribution, not just activity volume.
This guide breaks down the exact metrics to track for decision-maker prospecting and shows you how to build a reporting system that withstands CFO scrutiny.
Why DM engagement requires custom reporting
Marketing teams designed standard email metrics (opens, clicks, total reply rate) for newsletters, not executive outbound. They miss three things that define success in decision-maker prospecting: relationship depth, buying committee engagement, and true pipeline attribution.
Email open tracking is particularly unreliable because Apple Mail Privacy Protection pre-opens emails through proxy servers, triggering tracking pixels before any human reads the message. Unique and total open rates have nearly doubled in studies comparing pre- and post-MPP data, making open rate a misleading input for any prospecting forecast.
The fix is a framework built around revenue outcomes, not activity volume.
Tracking multi-touch vs. direct outreach
Sending one cold email to a VP of Sales is a direct outreach event. Running a coordinated campaign that touches the VP, the CRO, and a Director of Revenue Ops across three weeks is multi-touch account engagement. The two require different KPIs.
For direct outreach, track individual contact metrics: reply rate, meeting booked rate, and cost per meeting. For multi-touch campaigns, track account-level signals: stakeholders engaged per account, account reply sentiment, and pipeline influence percentage.
Use three criteria to select enterprise KPIs:
- Direct revenue link: A 10% improvement in the metric must translate to measurable pipeline or revenue impact.
- Rep-actionable: Reps must be able to influence the metric through daily activities. Positive reply rate is actionable. Company funding stage is not.
- Leading or lagging clarity: Leading indicators like target account engagement show whether you're on the right path. Lagging indicators like closed-won revenue confirm impact but move too slowly for weekly optimization.
Executive prospecting attribution hurdles
Two attribution blind spots consistently distort decision-maker reporting. First, the inbound inflation problem: outbound warms an account across multiple touches, but when the prospect visits your site and fills a form, your CRM credits the lead as inbound. The prospecting investment disappears from the record. Second, role-based misattribution: replies from non-economic buyers get weighted equally to replies from economic buyers, inflating reply rate without improving pipeline quality.
The email tracking integrations guide explains how disconnected tools amplify both problems and make CFO-trustworthy reporting nearly impossible.
Setting realistic measurement windows
Enterprise decision-makers do not move at SDR cadence, and B2B sales cycle benchmarks reflect this reality: SMB deals under $15K ACV (Annual Contract Value) close in 14-30 days, mid-market deals between $15K and $100K close in 30-90 days, and enterprise deals above $100K close in 90-180 days or longer. If you measure a 90-day enterprise campaign at the 30-day mark, you see 5-15% of actual returns.
Set attribution windows that match your typical sales cycle. Any reporting window that's shorter than your cycle will undercount prospecting ROI and misallocate budget.
Essential KPIs for decision-maker prospecting
The table below shows the core metrics every sales leader should track, along with definitions and healthy target ranges.
Metric | Definition | Target range |
|---|---|---|
Contact reach rate | % of targeted DMs whose email lands in primary inbox | 90%+ is strong, 70-89% is a risk zone |
Total reply rate (C-level) | % of C-level contacts who reply to any message | 6.4% average |
Positive reply rate | % of total replies showing genuine interest, excluding neutral and negative responses | 40-60% of total replies |
Conversation-to-meeting rate | % of positive replies that convert to a scheduled meeting | 30-50% depending on offer and CTA |
Cost per meeting | Total prospecting spend divided by meetings booked | Varies by industry, ACV, and team size |
Influenced pipeline (%) | % of closed-won revenue where outbound had at least one touchpoint before close | Benchmark against total closed-won revenue quarterly |
Contact reach rate by role
Contact reach rate measures whether your emails physically land in a decision-maker's primary inbox, not just whether they were delivered. A message that lands in spam is technically delivered but functionally invisible. For VP and C-level targets, inbox placement tests give you a real read on primary inbox rate before you send at full volume.
Target 90% or higher primary inbox placement. Rates between 70% and 89% are a risk zone that warrants investigation into authentication, complaint rates, and engagement segments. Below 70%, inbox placement rates signal a serious deliverability problem that will drag every downstream KPI, from reply rate to meetings booked.
Optimizing reply rates by seniority level
According to The Digital Bloom's cold outbound reply rate benchmarks, CTOs and VP Tech achieve the highest average reply rate at 7.68%, with Founders and CEOs close behind at 7.63%. C-level as a group replies at 6.4% versus 5.2% for non-C-suite, a 23% uplift.
The number that matters for your pipeline forecast is positive reply rate, not total reply rate. Across all outreach campaigns, 40-60% of all replies are neutral or negative ("not interested," "already using a competitor"). The email tracking myths article explains this gap clearly. Build your meeting forecasts on positive reply rate, which is typically 40-60% of your total reply volume after filtering out non-intent responses.
Tracking prospecting meeting efficiency
Cost per meeting is the most defensible ROI metric for CFO conversations. Calculate it as:
Cost per meeting = (Tool fees + SDR salary allocation + data costs) / total meetings booked
A fully loaded SDR (Sales Development Representative) costs approximately $9,500 per month when you include salary, benefits, and overhead, according to Martal. For a team running Instantly.ai with one SDR spending 50% of their time on outbound, the SDR time allocation alone is approximately $4,600 per month. Add your current tool fees to get your total monthly prospecting cost, then divide by meetings booked to get cost per meeting.
To put this in practical terms: if your cost per meeting sits above $300 in your first month, diagnose three areas first: whether your ICP (Ideal Customer Profile) filter is broad enough to let low-fit contacts through, whether your list has been verified to remove bounce risk, and whether your sequence ends before enough follow-ups have gone out. Addressing all three, tightening the ICP definition, verifying contacts before sending, and adding more follow-up steps to sequences that end too early, typically reduces cost per meeting faster than increasing raw send volume. In most cases, list quality and follow-up depth move the metric faster than sending more emails.
Instantly's opportunities in campaign analytics tracks which campaigns generate meetings and which sequences convert positive replies into booked calls, all in one view.
Measuring meeting effectiveness
Meeting-to-SQL rate bridges prospecting effort and pipeline generation. If your rate falls consistently low, the issue is usually ICP fit in the prospecting data or rep preparation before the call, not the outreach itself.
Three tactics that improve meeting hold rates:
- Pre-meeting agenda: Send a one-paragraph agenda 24 hours before the meeting. It signals preparation and gives the prospect a reason to show up.
- Two-touch reminder sequence: A 48-hour reminder followed by a 2-hour reminder with the video link reduces no-shows.
- Personalized pre-call brief: A short video reference or a relevant peer case study sent the day before reduces buyer hesitation and raises conversation quality.

How to track multi-touch campaign impact
Multi-touch decision-maker campaigns require account-level tracking, not just contact-level metrics. In many B2B deals, multiple stakeholders are engaged across numerous touches before a senior buyer agrees to a call. Measuring that outcome at the individual contact level can make every touch appear inefficient because no single message closes the account. Measuring at the account level gives you the full picture.
Key account engagement KPIs
Three account engagement KPIs give you the clearest read on multi-touch campaign health:
- Account engagement score: A composite of touches, reply sentiment, and stakeholder count per account. Accounts scoring above your defined threshold signal buying intent.
- Interaction frequency: A count of replies and responses across all contacts in a target account within your chosen measurement period. Rising frequency predicts pipeline entry.
- Stakeholder coverage rate: The percentage of your target accounts where you have engaged multiple contacts. Higher coverage correlates with deal speed.
Tracking DM penetration rates
Account penetration depth measures how many distinct stakeholders your team has engaged per target account. The data on multi-threaded engagement is consistent: according to Gong's analysis of 1.8 million opportunities, deals with 3 or more contacts engaged close 2.4x faster than single-threaded deals, and multi-threading boosts win rates by 130% on opportunities above $50K.
To track this accurately, every CRM contact record needs a parent account link and a campaign tag. RevOps owns this setup. SDRs own contact creation and engagement logging. Without both in place, your pipeline reports will undercount the true impact of multi-touch campaigns.
To put the 2.4x benchmark into practical terms: if your current single-threaded deals close in an average of 70 days, adding a second and third stakeholder to active accounts suggests a cycle closer to 30 days on those opportunities. The deals where you never expand beyond one contact will likely stay near your current average. That gap, measured in your own CRM data over one quarter, is the case for shifting SDR effort toward account coverage rather than raw contact volume.
Interpreting account-wide reply signals
Instantly classifies replies into labels including Interested, Not Interested, Out of Office, and custom categories you define, giving you a more granular read on account sentiment than a simple positive/negative split. Watch the signal-based cold email webinar from Instantly to learn how to read these signals at scale across a buying committee.
For accounts where one contact sends a negative reply but another contact opens and clicks, treat the account as still active. A single negative reply from a non-economic buyer is not a buying committee rejection.
Quantifying prospecting's revenue impact
Pipeline, wins, and revenue are the three numbers your CFO cares about. Everything else is a proxy.
Single vs. multi-touch attribution
Two attribution models dominate B2B outbound reporting. Understanding when to use each prevents both over- and under-crediting prospecting impact.
Model | How it works | Best for |
|---|---|---|
First-touch attribution | 100% credit to the first prospecting contact | Proving outbound creates new pipeline when your CFO questions outbound ROI |
Multi-touch attribution | Credit distributed across all touches | Enterprise deals with 90+ day cycles and 5+ stakeholder touches |
Last non-direct touch | Credit to the last outbound touch before inbound conversion | Catching accounts warmed by outbound but converted via web form |
For enterprise decision-maker campaigns, multi-touch attribution or last non-direct touch prevents the inbound inflation problem from hiding the true return on your outreach investment.
Prospecting opportunity volume
Track raw opportunity count generated by outbound separately from inbound-sourced opportunities. This gives you a clean baseline for calculating outbound's contribution to total pipeline coverage. Many sales teams find that a healthy outbound-sourced pipeline covers 4-5x their quarterly revenue target, because outbound-sourced deals convert at lower rates than inbound and require a larger buffer to hit quota.
The B2B email list pricing guide provides a practical framework for calculating cost per lead and cost per opportunity across different prospecting data sources.
How roles drive deal speed
Your reps compress sales cycle length fastest when they engage the economic buyer early. Track not just whether a meeting was booked, but whether the economic buyer was in the room. In many organizations, deals that include a senior economic buyer early in the conversation tend to carry higher average contract value than deals that do not.
Track ACV by prospecting contact seniority to prove this correlation in your own data. It becomes a compelling argument for dedicating SDR time to executive-level targeting rather than volume-based mid-level outreach.
Build your prospecting measurement system
A measurement system is only as good as the data flowing into it. Here's how to configure the right infrastructure, with clear owner assignments for each step.
Configure CRM for prospecting tracking
Owner: RevOps or Sales Operations.
A consistent UTM structure A consistent UTM structure utm_source=instantly&utm_medium=email&utm_campaign=[Campaign_ID] helps outreach touches sync cleanly into your CRM attribution reports. Set utm_source to your sending platform (for example, utm_source=instantly), utm_medium to email, and utm_campaign to the campaign ID from your sequence to tie each touch to its CRM record. SDRs own contact creation and engagement logging, AEs own opportunity stage progression, and RevOps audits sync accuracy weekly.
For connecting Instantly to your CRM, the integrations sync guide covers HubSpot native connection, Salesforce via OutboundSync, and Zapier and Make workflows for other CRMs.
Build sales leader prospecting dashboards
Effective prospecting dashboards for sales leaders typically cover these core views:
- Rep performance view: Track meetings booked, positive reply rate, and cost per meeting broken down by rep to spot performance gaps and replicate what your top performers do.
- Campaign comparison: Compare positive reply rate and meeting rate across sequences and target roles to identify which combinations drive the most pipeline.
- Account penetration view: Track the number of stakeholders engaged and overall engagement signal per target account to identify which accounts are warming and which need more coverage.
- Pipeline contribution: Compare outbound-sourced opportunities against total closed-won revenue each quarter to measure how much pipeline your prospecting activity is generating.
- Deliverability health: Monitor bounce rate, domain health score, and inbox placement rate per sending domain to catch issues before they drain reply volume.
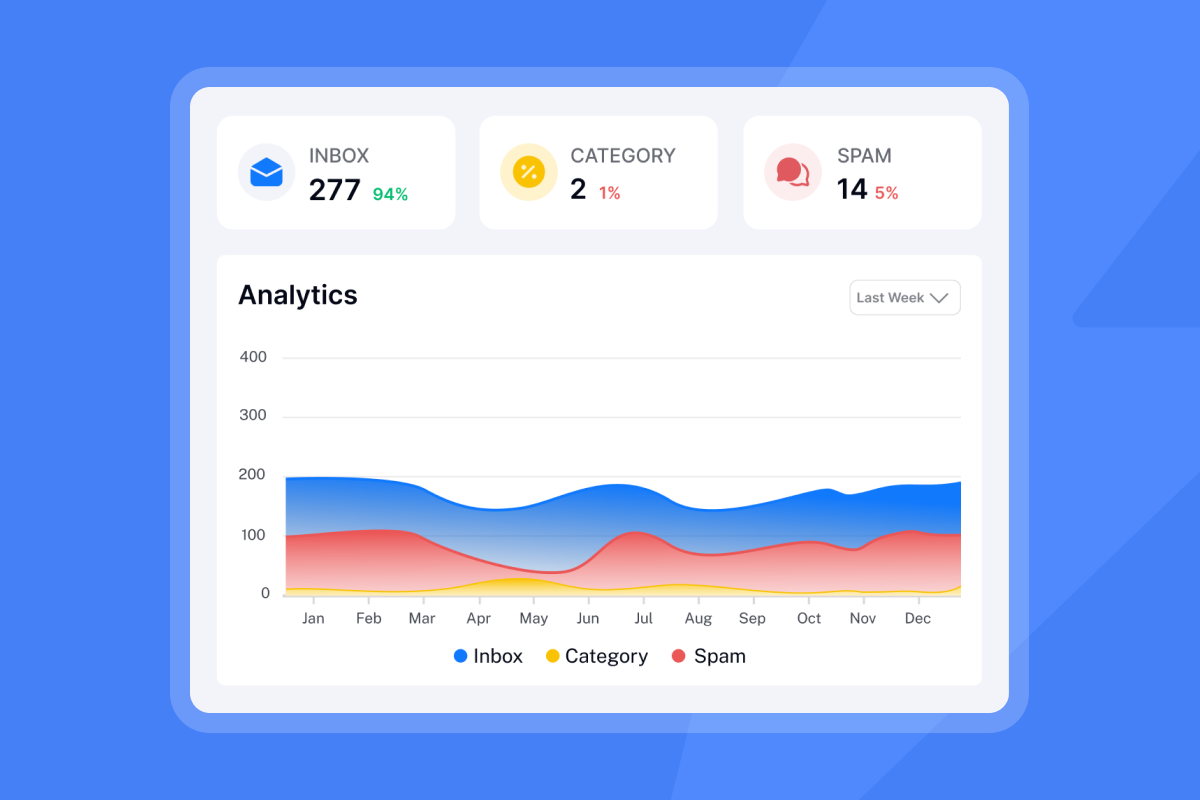
Instantly's campaign analytics connects sequence performance to pipeline outcomes without a manual CRM export. The Unibox centralizes all replies across unlimited inboxes and classifies them so your team measures positive reply rate accurately rather than counting all replies equally.
"Instantly makes it genuinely easy to run outbound at scale without feeling overwhelmed by complexity. The inbox rotation, sending controls, and campaign setup are all intuitive, which means you can go from idea to live campaign quickly." - Curtis S. on G2
Use these dashboards in weekly rep 1-on-1s by reviewing three numbers: positive reply rate versus target, meetings booked versus target, and cost per meeting versus baseline. The turning leads into meetings guide covers the specific follow-up steps that move positive replies to calendar events.
Pitfalls in evaluating outreach results
Two failure modes consistently distort prospecting reports and drain CFO trust: false signals in raw engagement data, and attribution blind spots that hide outbound's true pipeline contribution. Both inflate activity metrics while masking revenue impact, which means your dashboard looks healthy but your forecast remains fragile. Fix these before scaling spend.
False signals in prospecting data
Open rates have two fatal problems: Apple MPP inflates them by pre-opening emails on proxy servers, and security scanners click every link in an email to test for malware through click time protection, which can dramatically inflate click-through rate before filtering. After filtering, conversion tracking becomes reliable, but the raw numbers are meaningless for forecasting.
The email click tracking guide explains how to measure real engagement beyond open rates and configure click tracking to filter bot activity before it distorts your data.
Attribution blind spots in CRM reporting
The three most common attribution errors in B2B prospecting:
- Inbound inflation: Outbound warms an account across multiple touches, but when the prospect converts via web form, your CRM counts the lead as inbound. Fix this with the last non-direct touch model.
- Last-touch fallacy: The demo request gets 100% credit, ignoring the prior prospecting touches that built awareness. Fix this with multi-touch attribution in your CRM.
- Role-based misattribution: Replies from non-economic buyers receive equal weight to replies from decision-makers, inflating reply rate accuracy without improving pipeline quality.
Is your deliverability hurting metrics?
Poor deliverability creates a causal chain that collapses every downstream metric: low inbox placement means fewer opens, fewer opens mean fewer replies, fewer replies mean fewer meetings, and fewer meetings mean missed pipeline targets. By the time deliverability issues show up in your quarterly review, you've lost weeks of campaign output.
A healthy bounce rate should stay below 2%, with a target of under 1% to maintain strong sender reputation. If yours is trending above 2%, pause, re-verify the list, and run inbox placement tests before resuming at a lower daily send cap. Keep sends at or below 30 emails per inbox per day.
Instantly's automated inbox placement tests run before campaigns and alert you to deliverability issues before they drain meeting volume. The warmup network spans 4.2m+ accounts, which means your sending domains build reputation signals against a broad, active pool rather than a narrow shared cluster. The email deliverability for sequences guide covers warmup configuration, domain health monitoring, and compliance steps that protect sender reputation at scale. For valid A/B test results, aim for 1,000 or more sends per variant and a minimum two-week run time at a 95% confidence level. If volume limits you, 100-200 contacts per variant is the absolute floor, as the subject line testing governance framework details.
Start Instantly free and track contact reach, positive replies, and pipeline attribution in one dashboard.
FAQs
What is a realistic C-level reply rate for cold email outreach?
C-level contacts reply to cold email at an average total rate of 6.4%, compared to 5.2% for non-C-suite, a 23% uplift. Founders and CEOs reach the highest rates at 7.63%, but build pipeline forecasts on positive reply rate, which is typically 40-60% of total replies after filtering out neutral and negative responses.
When is your prospecting data statistically reliable?
Aim for 1,000 or more sends per variant and a two-week run time at a 95% confidence level before results are actionable. If volume is a constraint, 100-200 contacts per variant is the absolute floor. For campaign-level performance, measure against an attribution window that matches your sales cycle length so you capture full-cycle returns rather than a partial snapshot.
What are the two most predictive leading indicators for future pipeline?
Positive reply rate from target accounts and account penetration depth (the number of stakeholders engaged per account) are two leading indicators worth tracking closely alongside intent signals and buying committee expansion. Both tend to shift before pipeline entries appear in your CRM, which gives you a signal to adjust sequence copy, targeting, or sending volume while there is still time to recover.
How do you calculate prospecting campaign ROI?
Use this formula: ROI = (Pipeline attributed to outbound - Campaign cost) / Campaign cost x 100, where campaign cost includes tool fees, SDR salary allocation, and data spend. Track this by campaign in Instantly's opportunities analytics to identify which sequences generate the highest return per dollar spent.
Key terms glossary
Quality prospect throughput: A practical composite measure: verified, ICP-matched decision-makers who receive your message in their primary inbox and reply with genuine interest within your chosen attribution window. Use it as a proxy for true pipeline input rather than relying on raw contact volume alone.
Unibox: Instantly's centralized reply inbox that aggregates responses from all connected email accounts into one view, classifies replies by sentiment, and feeds reply data into campaign analytics for accurate positive reply rate tracking.
SISR (Server and IP Sharding and Rotation): A sending infrastructure setup where your outreach runs on dedicated private servers with rotating IP addresses, separate from shared sender pools. This reduces the risk of your domain inheriting a poor reputation from other senders on the same IP, which improves primary inbox placement at higher send volumes. Available on Instantly's Light Speed plan.
Contact reach rate: The percentage of targeted decision-makers whose emails land in the primary inbox rather than spam or promotions folders, measured using inbox placement tests before and during active campaigns.
Pipeline influence percentage: The share of closed-won revenue where outbound prospecting had at least one touchpoint in the buying cycle, measured using multi-touch or last non-direct touch attribution in your CRM.
Read next
Best Cold Email Sequence Templates to Win Replies in 2026: Browse proven sequence structures for cold outreach, with templates covering first touch, follow-up cadence, and breakup messages that keep reply rates consistent.
Find your ideal leads faster with Instantly's AI Copilot: See how Instantly's AI Copilot helps you find and filter high-fit leads faster, so your team spends time on prospects most likely to reply and convert.
Email Metrics Guide: Track What Actually Matters in 2026: A full breakdown of the email metrics worth tracking, what each one measures, how to benchmark it, and which numbers to stop reporting altogether.