Updated April 20, 2026
TL;DR: Most agency churn happens in the first 90 days, and a large share traces back to weak onboarding emails. The ROI formula is straightforward: measure what you spend on onboarding sequences, then quantify the retained revenue and avoided CAC you get back. Clients who activate quickly retain at twice the rate of those who take 90+ days. A 5% retention improvement can lift profits by 25-95%, meaning even a modest onboarding investment pays back fast. Use the calculator below to run your numbers.
Most agencies obsess over new client acquisition and neglect what happens immediately after the contract is signed. That's a costly blind spot. Up to 67% of customer churn traces back to onboarding failures, and the financial damage compounds every month you don't fix it.
Your client onboarding email sequence is the first automated touchpoint a new client experiences with your agency. Get it right and you speed up activation, build confidence, and protect retention. Get it wrong and you burn CAC you spent months earning. This framework gives you the calculator, the metrics, and the measurement playbook to quantify every dollar your client onboarding emails produce or protect. It also compares the three most common onboarding sequence structures, drip, milestone-triggered, and hybrid, so you can choose the approach that fits your client size and complexity.
Why onboarding email ROI matters for agencies
The cost of early churn
44% of subscription cancellations happen within the first 90 days. That is not a product problem. It is an onboarding problem. Poor onboarding increases churn by 30% in that same window, and 23% of all customer churn ties directly to poor onboarding experiences.
For an agency charging $3,000 to $10,000 per month per client, losing a client at 60 days means you recovered almost nothing against your acquisition cost. Acquiring a new B2B customer costs 5 to 25 times more than retaining an existing one, according to Invesp research, and that economic reality puts a hard ceiling on how many early churns you can absorb before margins collapse.
The fix doesn't require hiring another account manager. A structured onboarding email sequence, built around activation milestones and timed follow-ups, addresses the most common early-churn drivers: confusion, slow time-to-value, and the feeling that the agency "disappeared" after signing.
What early activation means for retention
Early activation drives retention. Customers who activate within the first week retain at 2-3x higher rates. The implication is direct: your onboarding emails are not just a welcome formality. They are a retention lever with a measurable multiplier.
The sequence you send in the first two weeks determines whether a client builds product habits, schedules their next check-in, or quietly starts shopping alternatives. A well-timed email click tracking setup shows exactly where clients disengage. Fix the dropout before it becomes a cancellation.
The metrics that actually matter for client onboarding emails
Open rates are a starting point, not a finish line. Apple Mail Privacy Protection automatically marks emails as opened for Apple Mail clients, inflating the number you see in your dashboard. Relying on opens alone gives you a false read on how engaged your new clients actually are.
Here is the metric hierarchy that connects to real business outcomes.
Beyond open rates: engagement signals that predict retention
Metric | What It Measures | Target Benchmark | Why It Matters |
|---|---|---|---|
Reply rate | Client responds to onboarding email | 10-15% for first onboarding email | Strongest early signal of engagement and intent to activate |
Click-through rate (CTR) | Client clicks any link in email | 20%+ for onboarding sequence | Shows active interest in setup resources and next steps |
Click-to-open rate (CTOR) | Clicks divided by opens | 15%+ for resource links | Filters out inflated Apple Mail opens, measures true engagement |
Open rate | Email marked as opened | 40-60% (inflated by Apple Mail) | Starting point only, unreliable for activation prediction |
- Reply rate: A reply to your onboarding email is the strongest early signal of client engagement. Track this as your primary health signal alongside activation milestone completions.
- Click-through rate (CTR): Average email CTR in 2025 sits at 2.09% across all email types. Onboarding sequences typically outperform this baseline since recipients have high intent and expect setup instructions. Track CTR for links to setup resources, dashboards, or milestone checklists.
- Click-to-open rate (CTOR): The average CTOR in 2025 is 6.81%, up from 5.63% the year prior. Onboarding emails from warm contacts with clear next steps tend to perform above this average.
- Completion rate per sequence step: Track what percentage of clients reach each email in your sequence without disengaging. Dropout at step 2 signals a different problem than dropout at step 5.
- Time-to-first-reply: A client who responds to your welcome email within 24 hours is signaling active engagement. One who doesn't reply within 72 hours needs a follow-up variant.
Automated onboarding sequences help deliver the right message at the right moment without manual effort from your team.
Our guide on email tracking for customer service covers how to structure these tracking setups so activation milestones are captured automatically, not just when someone remembers to log them.
Time-to-first-result as a core KPI
Time-to-first-result (also called time-to-value, or TTV) measures how long it takes a new client to experience the outcome they bought your service for. It is the single most powerful predictor of whether they stay beyond 90 days.
To track TTV through email, define the activation milestone for your service (first report delivered, first leads generated, first campaign live) and embed a confirmation email trigger at that point. When a client hits the milestone, log the date. Calculate the average TTV across all new clients in a given cohort and compare it against retention rates by TTV bucket.
If email-engaged clients reach their first result 10 days earlier than non-engaged clients, your sequence is creating measurable value before a single call happens.
Satisfaction scores during onboarding
NPS and CSAT are not vanity metrics. Research links NPS to long-term loyalty and revenue growth, with promoters more likely to buy again and try new offerings.
Send a short NPS or CSAT survey at day 14 and day 45 of onboarding. These are natural inflection points where clients have formed initial opinions but are still adjustable. A CSAT drop at day 14 signals your onboarding sequence is confusing or missing key context. A strong NPS at day 45 signals the client is on track to renew and potentially expand.
Build these survey triggers into your onboarding email sequence so measurement happens automatically, not when you remember to ask.
The client onboarding email ROI calculator
This calculator gives you a framework you can run in a spreadsheet or build into a simple tool. The formula combines avoided churn cost, retention improvement value, and email program costs to produce a net ROI figure.
Inputs (with defaults)
Enter your actual numbers in the "Your value" column. Defaults are based on industry benchmarks from Mailjet and Campaign Monitor research.
| Input | Default | Your value |
|---|---|---|
| Average client monthly retainer ($) | $3,000 | |
| Average client contract length (months) | 12 | |
| New clients onboarded per month | 5 | |
| Current 90-day churn rate (%) | 10% | |
| Target 90-day churn rate after improvement (%) | 10% | |
| Monthly email platform cost ($) | $141 | |
| Monthly labor for sequence management (hrs) | 4 | |
| Hourly rate for labor ($) | $75 | |
| Current onboarding email reply rate (%) | 5% | |
| Target reply rate after optimization (%) | 12% |
The 15% 90-day churn default reflects a realistic starting point for agencies with inconsistent onboarding. If your current rate is lower, the retained revenue figures in the output will be smaller, but the labor recovery value (covered in the objections section below) remains meaningful. The $141 monthly platform cost shown here reflects Instantly's starter stack at current rates (Outreach $47, SuperSearch $47, CRM $47), though pricing is subject to change, verify current costs on the pricing page before calculating your specific ROI.
Formula and assumptions
The ROI calculation works in three parts.
Part 1: Avoided churn cost
Monthly clients at risk = New clients per month × Current 90-day churn rate
Clients saved per month = Monthly clients at risk × (Churn rate delta / Current churn rate)
Annual clients saved = Clients saved per month × 12
Revenue recovered = Annual clients saved × Average retainer × Average contract length
Part 2: Email program cost
Monthly cost = Platform cost + (Labor hours × Hourly rate)
Annual cost = Monthly cost × 12
Part 3: ROI
Net gain = Revenue recovered - Annual program cost
ROI (%) = Net gain / Annual program cost × 100
ROI multiple = Revenue recovered / Annual program cost
Example calculation with defaults:
- Sample monthly clients at risk: 5 × 15% = 0.75 clients
- Churn rate delta: 15% - 10% = 5 percentage points
- Relative improvement: 5 / 15 = 33.3%
- Clients saved per month (illustrative): 0.75 × 33.3% = 0.25 clients
- Annual clients saved (illustrative): 0.25 × 12 = 3 clients
- Revenue per retained client (full contract): $3,000 × 12 = $36,000
- Potential revenue recovered annually: 3 × $36,000 = $108,000
- Sample annual program cost: ($141 + 4 hrs × $75) × 12 = $441 × 12 = $5,292
- Potential net gain: $108,000 - $5,292 = $102,708
- Illustrative ROI: 1,941%
- Illustrative ROI multiple: approximately $20.40 recovered per $1 spent
This aligns with email marketing's broadly reported return. The Data and Marketing Association benchmarks show $35-$40 returned for every $1 spent on email marketing, and your onboarding sequence operates in the highest-value window of the customer relationship.
The standard ROI formula is: ROI = (Money Gained - Money Spent) / Costs × 100%. The calculator above applies this directly to the retention improvement your sequence generates.
How to interpret results
A few principles to apply when reading your output.
ROI above 500% means your onboarding email investment is delivering strong retention leverage. Your primary action is to optimize sequence quality, not increase spend.
ROI between 100% and 500% indicates a solid program with room to improve. Run A/Z tests on subject lines and email timing to push reply rates up. Per NPS research, similar engagement improvements correlate to measurable revenue gains.
ROI below 100% points to one of three causes: your sequence isn't reaching inboxes (deliverability problem), your content isn't driving action (copy or structure problem), or your churn rate is already low enough that the improvement headroom is small.
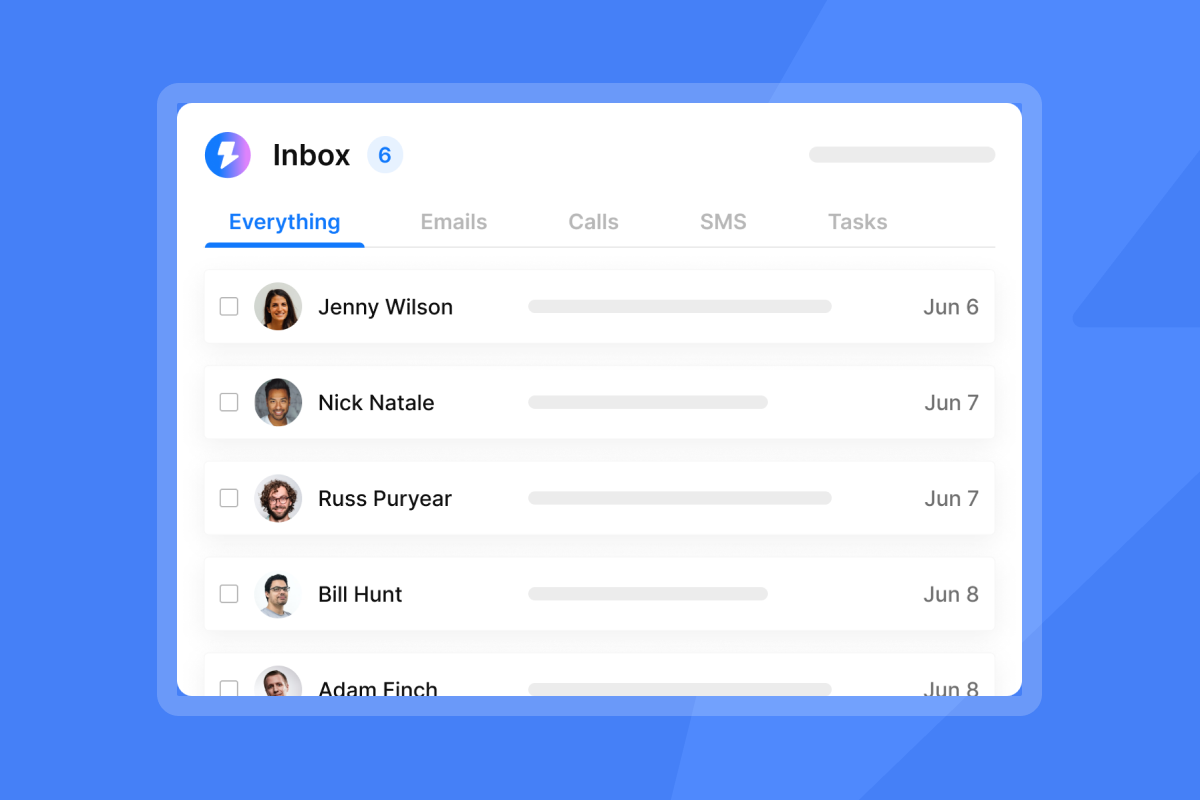
Our Unibox gives you a centralized view of every client reply across all sequences, so you can audit engagement patterns without manually checking individual inboxes.
Sensitivity analysis
The table below shows how different churn reduction scenarios affect your ROI multiple when all other variables remain constant, using the default inputs above.
Churn improvement | Clients saved/yr | Revenue recovered | ROI multiple |
|---|---|---|---|
Lower churn scenarios can improve retention economics | Varies by baseline churn and client count | Depends on average contract value | Multiple increases as churn drops |
Note: Actual results depend on your starting churn rate, client base size, and contract value. Run your own numbers using the formula above.
The biggest lever is always the churn rate delta. A 5 percentage-point improvement in early churn is achievable with a well-structured sequence. SmartReach.io reduced churn from 27% to 17.5% within one year by combining improved onboarding with proactive risk assessment. Helios Health brought 90-day activation from 52% to 79% through onboarding improvements alone.
A 5% improvement in retention can increase profits by 25% to 95%. That range reflects genuine variance by business model and price point. For agencies with higher-value retainers, the profit impact lands at the upper end.
Download and export
To build this calculator in a spreadsheet:
- Copy the inputs table into a Google Sheet or Excel with a "Default" column and a "Your value" column.
- Build the three formula blocks in separate rows with clear labels for clients at risk, clients saved, and revenue recovered.
- Add a summary row showing ROI %, ROI multiple, and annual clients saved.
- Create a sensitivity table by substituting churn improvement values of 3, 5, and 10 percentage points.
- Add a chart plotting ROI multiple against churn improvement delta to visualize your upside range.
You can also track these numbers directly inside Instantly's campaign analytics by tagging each client onboarding campaign separately and monitoring reply rates by cohort.
How to measure onboarding email impact on revenue
Retention rate improvement
Track retention by cohort, not in aggregate. Group clients by the month they onboarded, then track their 30-day, 90-day, and 12-month retention rates separately. When you change your onboarding sequence, compare the retention curve for post-change cohorts against pre-change cohorts at the same time intervals.
This cohort approach removes noise from seasonal factors and gives you clean causality signals. When you compare pre-change cohorts against post-change cohorts at the same time intervals, any consistent improvement in the retention curve points directly to your sequence changes rather than external market factors.
The first 90 days are the highest-risk window. Set your primary measurement checkpoint at day 90 and your secondary checkpoints at day 30 and day 14. Track email-driven outcomes for a minimum of 90 days post-send to capture delayed activation events that don't show up in the first two weeks.
NRR impact formula
Net Revenue Retention (NRR) captures both retained revenue and expansion revenue from existing clients. Monthly recurring revenue (MRR) is the base unit for this calculation. The formula is:
NRR = ((Beginning MRR - Churned MRR + Expansion MRR) / Beginning MRR) × 100
An NRR above 100% means your existing clients are growing in value even after accounting for churn. Improving your onboarding sequence lifts NRR by reducing churned MRR and creating conditions for expansion through trust and early success.
An agency with $50,000 MRR that improves NRR from 90% to 95% adds $2,500 per month in recurring revenue, moving from $45,000 monthly at 90% to $47,500 at 95%. This 5-percentage-point lift produces $30,000 annually from the same client base.
Attribution modeling for onboarding emails
Multi-touch attribution is widely considered more accurate for onboarding sequences because retention involves multiple contact points: emails, calls, dashboards, and product interactions. Email often acts as an assist rather than the last touch in B2B retention journeys.
For practical agency use, apply a time-decay model for your onboarding attribution. This model weights touchpoints closer to the activation event more heavily, which makes sense for tightly sequenced onboarding emails where all messages are clustered in a short window.
Attribution setup requires three data sources working together:
- Email platform data: Opens, clicks, replies, and sequence completion rates per client
- CRM data: Activation milestones, onboarding completion status, and contract dates
- Revenue data: MRR by client, expansion events, and churn dates
Our integrations with HubSpot and Salesforce let you sync email engagement data directly to client records, so attribution happens automatically rather than through manual spreadsheet reconciliation.
Key limitations to acknowledge: Apple MPP inflates open rates, so anchor your attribution on click and reply data for cleaner results. Some onboarding sequences also have delayed effects on renewal decisions that don't appear in 30-day windows. Our guide on email open tracking accuracy covers exactly why this matters and how to compensate. The email tracking myths guide gives additional context on which signals to trust.
How Instantly helps you track and optimize client onboarding emails
"I find Instantly easy to set up with really nice UX, making the onboarding process smooth. The platform excels in scalability, allowing me to send a large volume of emails and manage workspaces effectively for sales and marketing." - Frank S. on G2
Instantly's unified inbox for tracking client replies
Our Unibox consolidates replies from all your client onboarding sequences into one dashboard. For agencies managing 10 or more active client onboarding flows simultaneously, this removes the most common attribution gap: the reply that sits unread in a siloed inbox while a client waits for acknowledgment.
With Unibox, you can filter by campaign, tag replies by activation stage, and measure response time at scale. Reply time is one of the strongest early signals of onboarding health. A client who replies within 24 hours is signaling strong early engagement, and tracking that signal across your entire client base becomes feasible when all replies land in one place.
"I find the auto-replies generated as suggestions to be very helpful and time-saving. The Unibox feature and the capability to filter leads based on campaign replies enhance my workflow significantly, making the task of managing and sorting communications much more efficient." - Adrian F. on G2
For a full walkthrough of how the platform handles reply management and sequences, the co-founder demo walkthrough covers the core workflow in under 20 minutes.
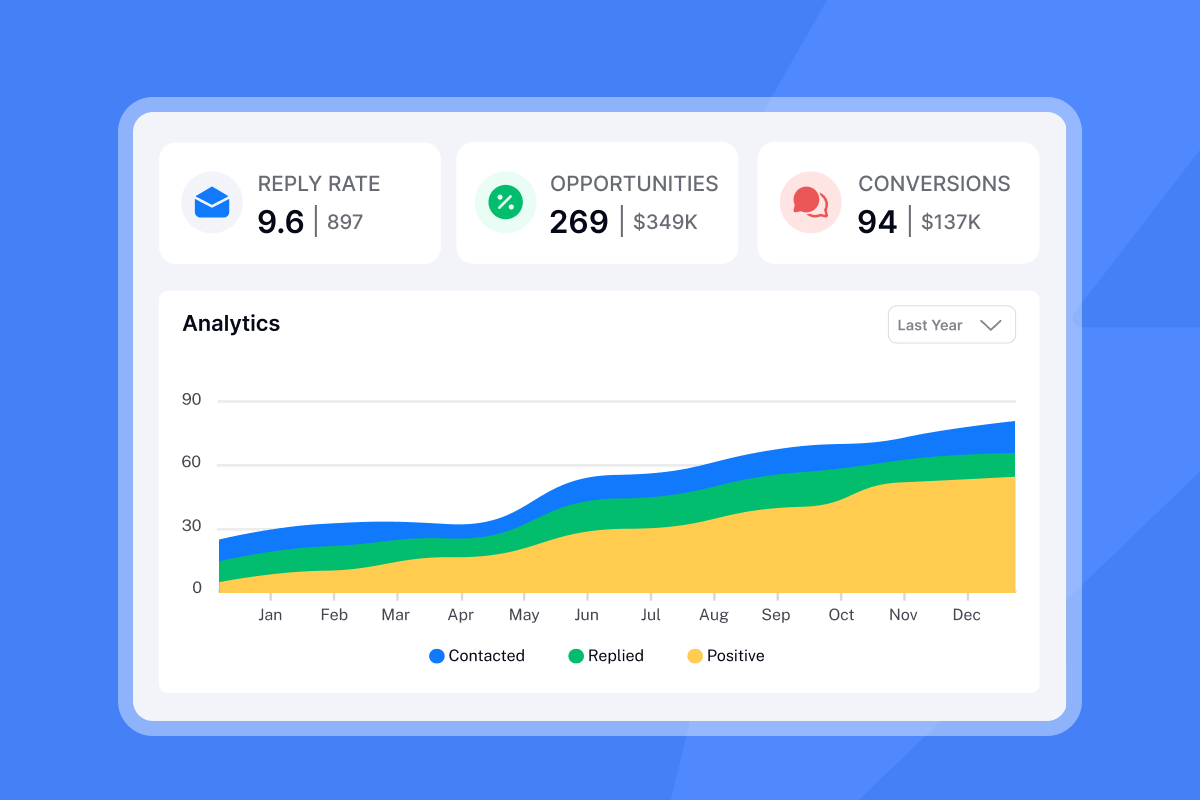
Instantly's analytics for campaign performance
Our analytics layer gives you per-campaign and per-sequence performance data, including open rates, click rates, reply rates, and sequence completion percentages. For onboarding ROI tracking, the most useful view is sequence-level analytics broken down by send date, which lets you run cohort comparisons directly inside the platform.
"I appreciate the real-time visibility into opens, replies, and engagement, which makes it simple to quickly understand what's working and how to optimize accordingly." - Steven M. on G2
For agencies using the Hyper CRM plan ($97/mo), team reporting gives you aggregate performance across all client onboarding campaigns, including cross-account comparison. This is where the email tracking integrations guide becomes useful: syncing Instantly's sequence data to your CRM means activation milestones and email engagement appear on the same client record.
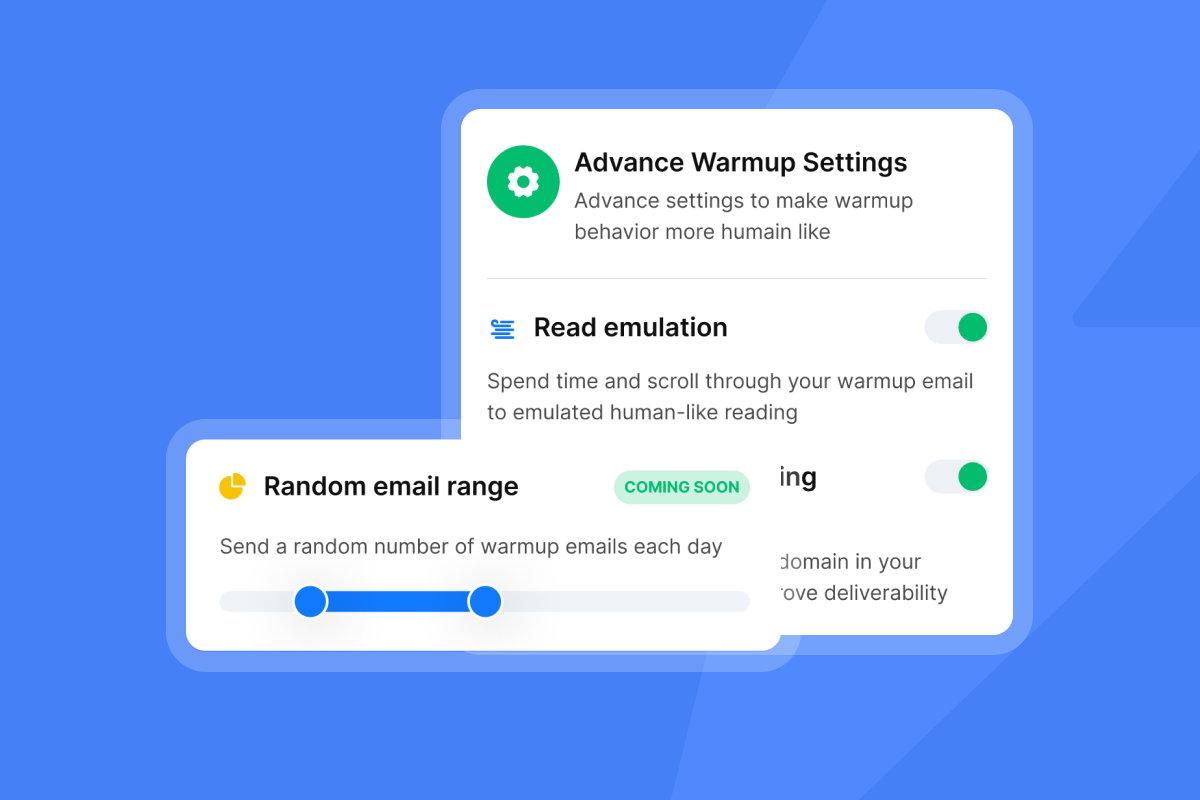
Our email deliverability monitoring layer also matters here. Your onboarding emails can only drive ROI if they reach the primary inbox. Our built-in warmup network covering 4.2M+ accounts and automated Inbox Placement tests give you confidence that onboarding emails are landing where clients will actually see them.
"Instantly has saved me a lot of time compared to other tools I've used in the past... The initial setup was very easy because of the tour guide." - Dheeraj P. on G2
Instantly's A/Z testing for optimization
A/Z testing is available on all plans, including Growth at $47/month, following the most recent pricing update. This means you can run subject line and copy tests without upgrading to a higher tier.
For onboarding sequence optimization, run A/Z tests on:
- Subject lines in the welcome email: Test a personal tone ("Your onboarding starts now") against a milestone-focused line ("Your first deliverable is ready") and measure which drives faster activation.
- Call-to-action placement: Test email length and whether the primary CTA appears in paragraph one versus paragraph three.
- Timing of the follow-up email: Test sending the first follow-up at 48 hours versus 72 hours after the welcome email.
Segmented email campaigns generate 30% higher CTR than non-segmented ones. Splitting your onboarding sequences by client type (retainer vs. project, SMB vs. mid-market) and running separate A/Z tests per segment gives you cleaner data and faster improvement cycles.
Our subject line testing governance framework and the pre-send subject line checklist give you the exact process for running these tests without introducing deliverability risk.
For a guided setup of sequences and A/Z testing, the full Instantly AI guide covers both features. The advanced tutorial goes deeper on automation logic and sequence branching for more complex onboarding flows.
Common objections to onboarding email investment
Here are the four most common objections agencies raise when considering onboarding email investment, and what the data actually shows.
Objection: "Email open rates are declining."
This is outdated. In 2025, opens, clicks, and unsubscribes all rose year over year. Average open rates reached 43.46% across all email types, and welcome emails for SaaS products regularly hit 50-70%. The real issue is Apple MPP inflating individual open metrics, which means you should optimize for click and reply rate, not open rate. Those metrics are more accurate and more predictive of activation.
Objection: "Clients prefer calls over emails."
Email and calls are not competing channels in onboarding. They're complementary. Email handles consistent, repeatable information delivery (setup links, milestone confirmations, resource guides) while calls handle relationship-building and judgment calls. Removing email shifts that burden entirely onto your team's calendar. If email-engaged clients activate at 2-3x the rate of non-engaged clients, your sequence is adding value regardless of whether clients also receive calls.
Objection: "The ROI is too hard to measure."
The formula above is straightforward. Calculating your email marketing ROI starts with three numbers: what you spend, how many clients you retain that you otherwise would have lost, and what those clients are worth. You don't need a sophisticated attribution platform to get directional signal. A cohort analysis in a spreadsheet, comparing 90-day churn rates before and after sequence changes, is sufficient to build a business case.
Objection: "We already have a low churn rate."
If your 90-day churn rate is already below 10%, the retained revenue ROI in the calculator above will be smaller. In that case, reframe the value: faster time-to-first-result reduces the time your team spends on reactive client check-ins, which recovers labor hours. Track how many inbound "where are we at?" emails your team receives in the first 30 days before and after improving the sequence. That labor recovery is real margin improvement even when retained revenue uplift is modest.
FAQs
What is a good reply rate for a client onboarding email?
A reply rate of 8-15% is a reasonable target for client onboarding emails. Because onboarding recipients have just signed a contract and are actively expecting setup communication, a reply rate below 5% signals either a deliverability problem or that the email isn't giving clients a clear reason to respond.
How do you calculate the ROI of a new client onboarding email?
ROI = (Revenue recovered - Annual program cost) / Annual program cost × 100. Use your actual 90-day churn rate, average client retainer, contract length, and email platform costs as inputs. The calculator section above walks through a full example with defaults.
Which metrics best predict whether an onboarding email sequence is working?
Reply rate and click-through rate are the two strongest predictors because they reflect active engagement rather than passive exposure. Track these alongside time-to-first-result per cohort and 90-day churn rate by sequence version. Open rates are unreliable due to Apple Mail Privacy Protection and shouldn't be used as a primary success metric.
How many emails should a client onboarding sequence include?
A 5-8 email sequence spread across the first 30 days covers the main activation milestones without overwhelming a new client. A typical structure: welcome on day 1, setup confirmation on day 3, first milestone check-in on day 7, value-proof email on day 14, and a satisfaction check (NPS or CSAT) on day 30. Extend with follow-ups at day 45 and day 60 for clients who haven't reached full activation.
How quickly can better onboarding emails reduce churn?
Expect cohort-level churn improvements within 60-90 days of deploying an improved sequence, since that's the window where onboarding-related churn is most concentrated. SmartReach.io reduced churn from 27% to 17.5% within one year by combining improved onboarding with proactive risk monitoring. Helios Health moved 90-day activation from 52% to 79% through targeted onboarding changes alone.
Start measuring what your onboarding emails are worth
Early churn is expensive, activation speed predicts retention, and a structured onboarding email sequence is one of the highest-ROI investments an agency can make. The calculator in this guide gives you the framework to put real numbers against that claim using your own client data.
Run the inputs with your current churn rate and retainer value. If the ROI multiple comes out above 10x, the next question isn't whether to invest but where to start optimizing first.
Ready to build and track client onboarding sequences with built-in deliverability, A/Z testing, and Unibox reply management? Try Instantly free and use the sequence builder to deploy your first improved onboarding flow this week.
Read next
- Email tracking implementation checklist: 30-day rollout guide
- Email click tracking: measuring engagement beyond open rates
- Cold email subject lines for follow-ups: re-engage without being pushy
- Email tracking myths debunked: what the data really shows
- Do you really need email tracking: diagnostic quiz for sales leaders